| Introduction |
| Publications |
| Download |
MARS software : Maintenance Assessment of Repairable Systems
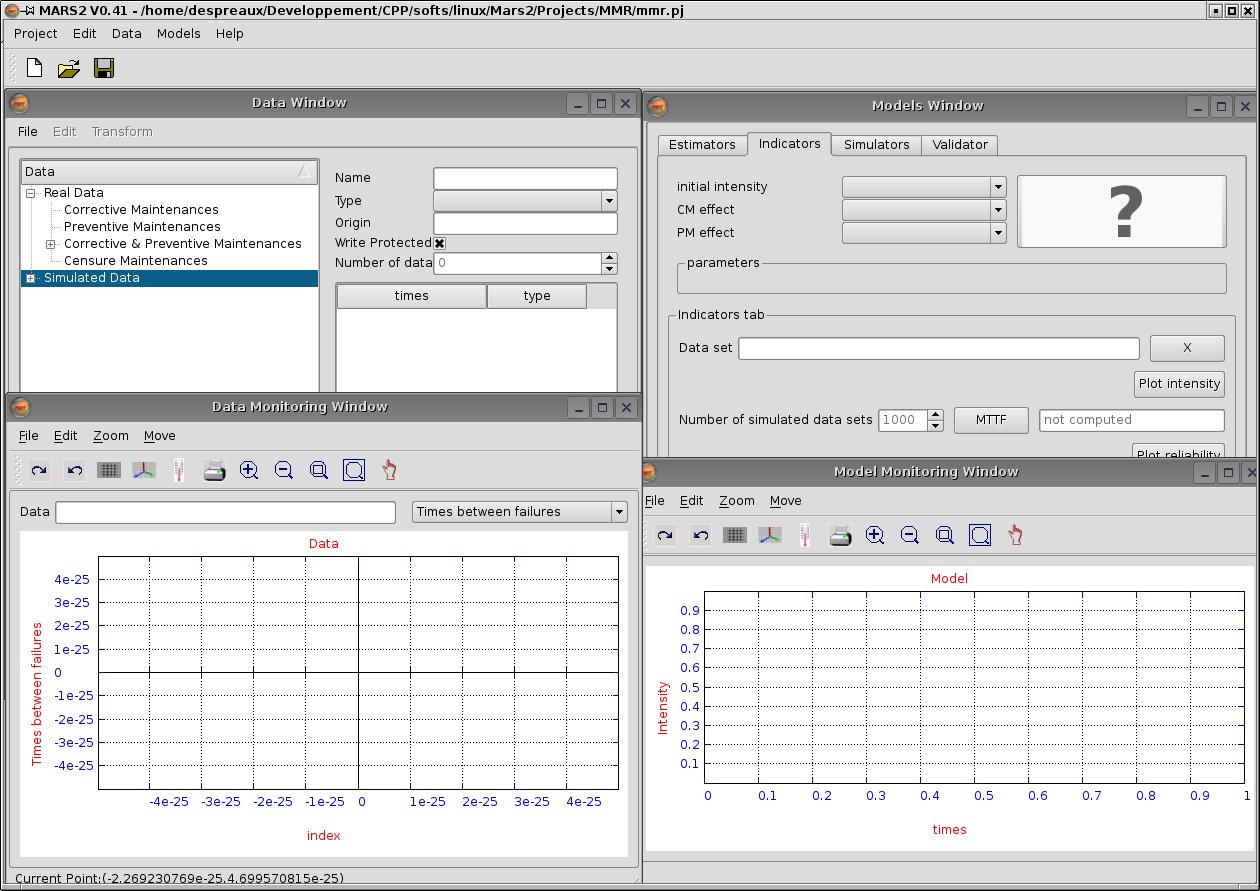
MARS software has been developped in C++ using Qt libraries for graphics interfaces. It works on Windows and Linux platforms. When lauching Mars, the interface looks as in figure 1 after opening a project (Project/New Projet) and showing all windows (Edit/Show Data Window).
The window in the upper left corner is the Data Window which displays all the data sets available for analysis. The window in the bottom left corner is the Data Monitoring Window, which shows graphical descriptions of the chosen data set. The window in the upper right corner is the Models Window. It contains four tabs, described in the following : Estimators, Indicators, Simulator and Validator. The window in the bottom right corner is the Model Monitoring Window which displays indicators graphics : intensity, reliability, cumulative number of failures.
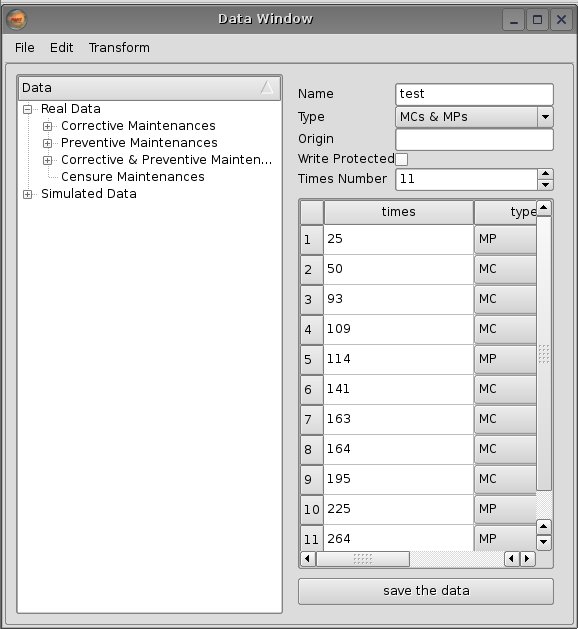
The Data Window is used to manipulate data sets. The data sets are organized in 2 classes: real data sets issued from field feedback and simulated data sets issued from MARS simulations. Each class is divided in 3 subclasses depending on the type of maintenances in the data set: only CM, only PM, and either CM and PM. When selecting a data set, the maintenance times appear in a table as shown in figure 2. Some operations are enabled on data: importing or exporting in text or xml format (File menu), copying or removing data sets (Edit menu), translating or cutting data (Transform menu).
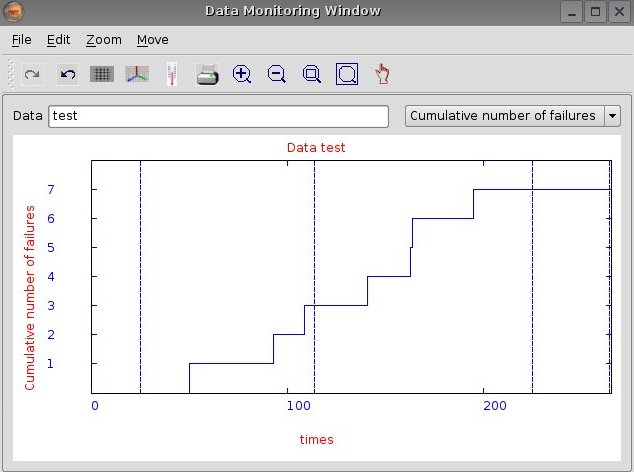
To plot graphical descriptions of a selected data set, drag and drop the data from the Data Window to the line edit component next to Data of the Data Monitoring Window and select the curve to plot, times between failures or cumulative number of failures (as in figure 2). Basic operations such as zooming and moving are enabled on the drawing area.
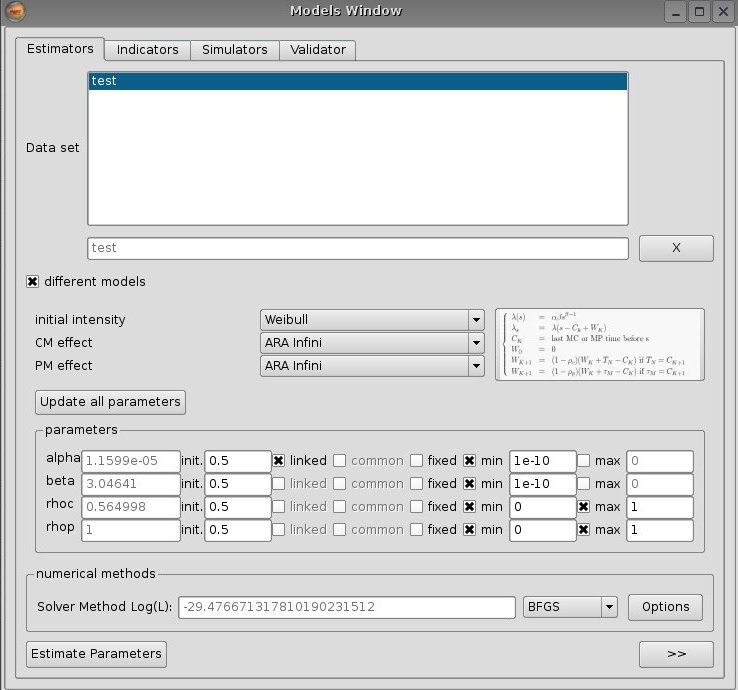
The Models Window performs the analysis of one or several data sets with a given model. First, drag and drop the data set from the Data Window to the list box component of the Estimators tab of the Models Window. Then, select a model. Click on the Estimate Parameters button in order to estimate the model parameters by the maximum likelihood method (see figure 3). MARS uses a simple or multiple BFGS algorithm in order to maximize the log-likelihood (5).
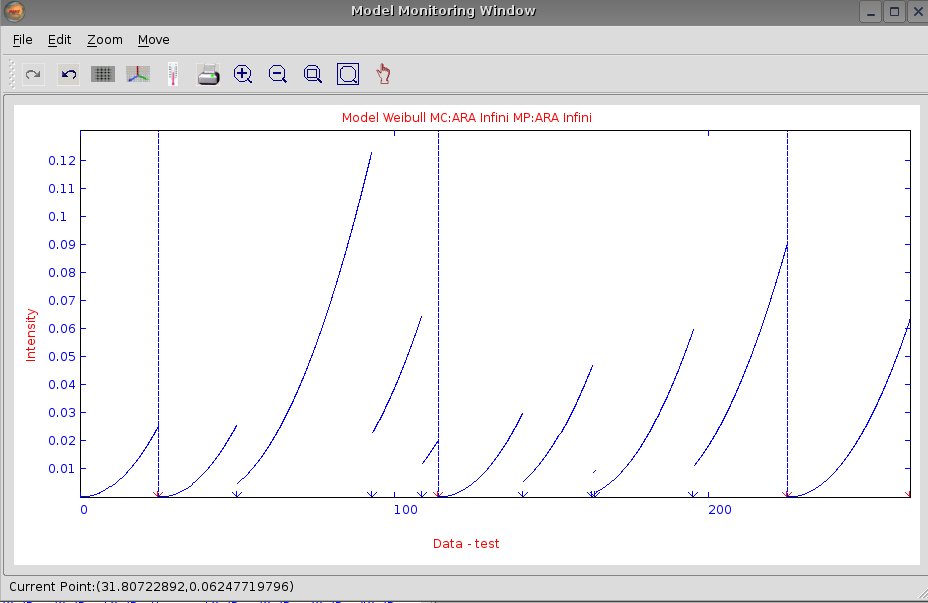
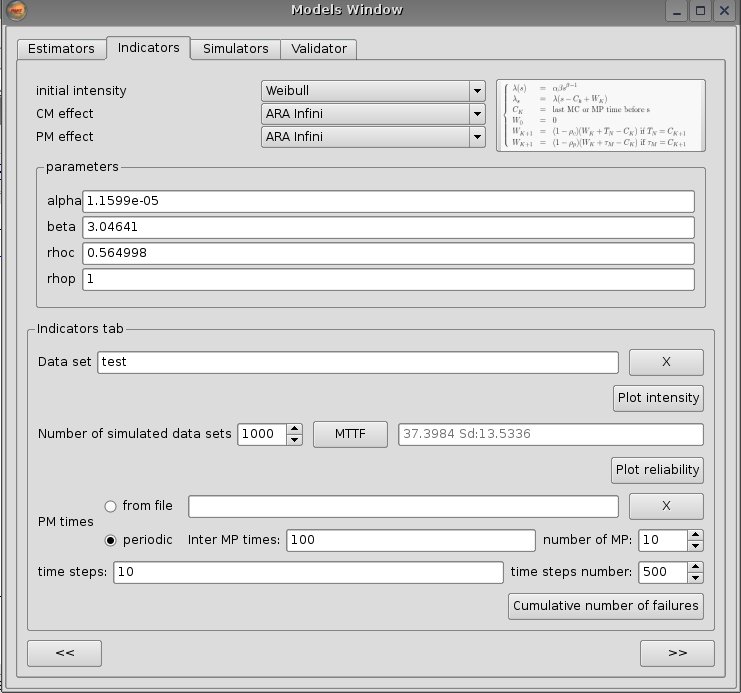
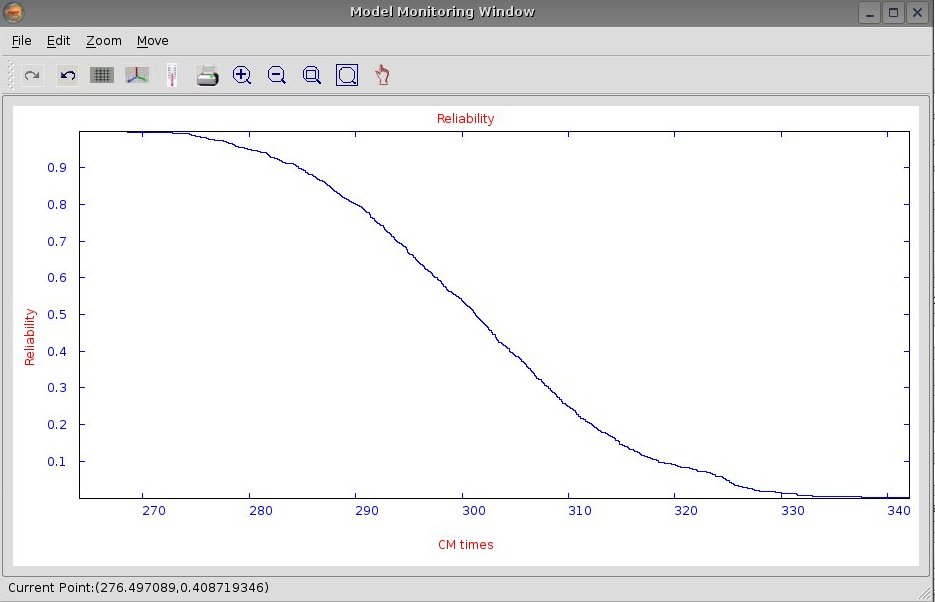
With a click on the ![]() button, the Indicators tab is selected and the model and data set analyzed from the estimator tab are also selected in the indicator tab. Then, click on the Plot Intensity button to plot the estimated intensity in the Model Monitoring Window, as in figure 3. The Indicators tab enables also to compute several reliability indicators : the predicted MTTF value, the estimated reliability function (see figure 4) and the predicted future cumulative number of failures.
button, the Indicators tab is selected and the model and data set analyzed from the estimator tab are also selected in the indicator tab. Then, click on the Plot Intensity button to plot the estimated intensity in the Model Monitoring Window, as in figure 3. The Indicators tab enables also to compute several reliability indicators : the predicted MTTF value, the estimated reliability function (see figure 4) and the predicted future cumulative number of failures.
To simulate data from a model, select the Simulator tab. Then, choose the appropriate model, fill the simulation parameters and click on the Simulate data button. Then, a data set is generated and added to the data sets of the Data Window in the Simulated Data class. The graphical descriptions of the simulated data set are directly shown in the Data Monitoring Window.
The last tab Validator is used to validate the estimation procedure and to assess its quality. The bias and variance of the estimators are assessed by means of intensive simulations.
Stephane Despreaux 2009-06-10

